ePlant Data Metrics
The ePlant data metrics are derived from the raw dendrometer signals, and presented on a daily basis. Because the raw signals are commonly condensed and interpreted in a few standard ways, the metrics are useful as they perform these calculations automatically and are then available through the data portal. Most commonly, dendrometer signals show the tree with one broad contraction and swelling per day, and the utility of the metrics rests to a large degree on this assumption. With highly anomalous raw signals, the interpretation of the metrics becomes less clear cut.
Contents:
Growth
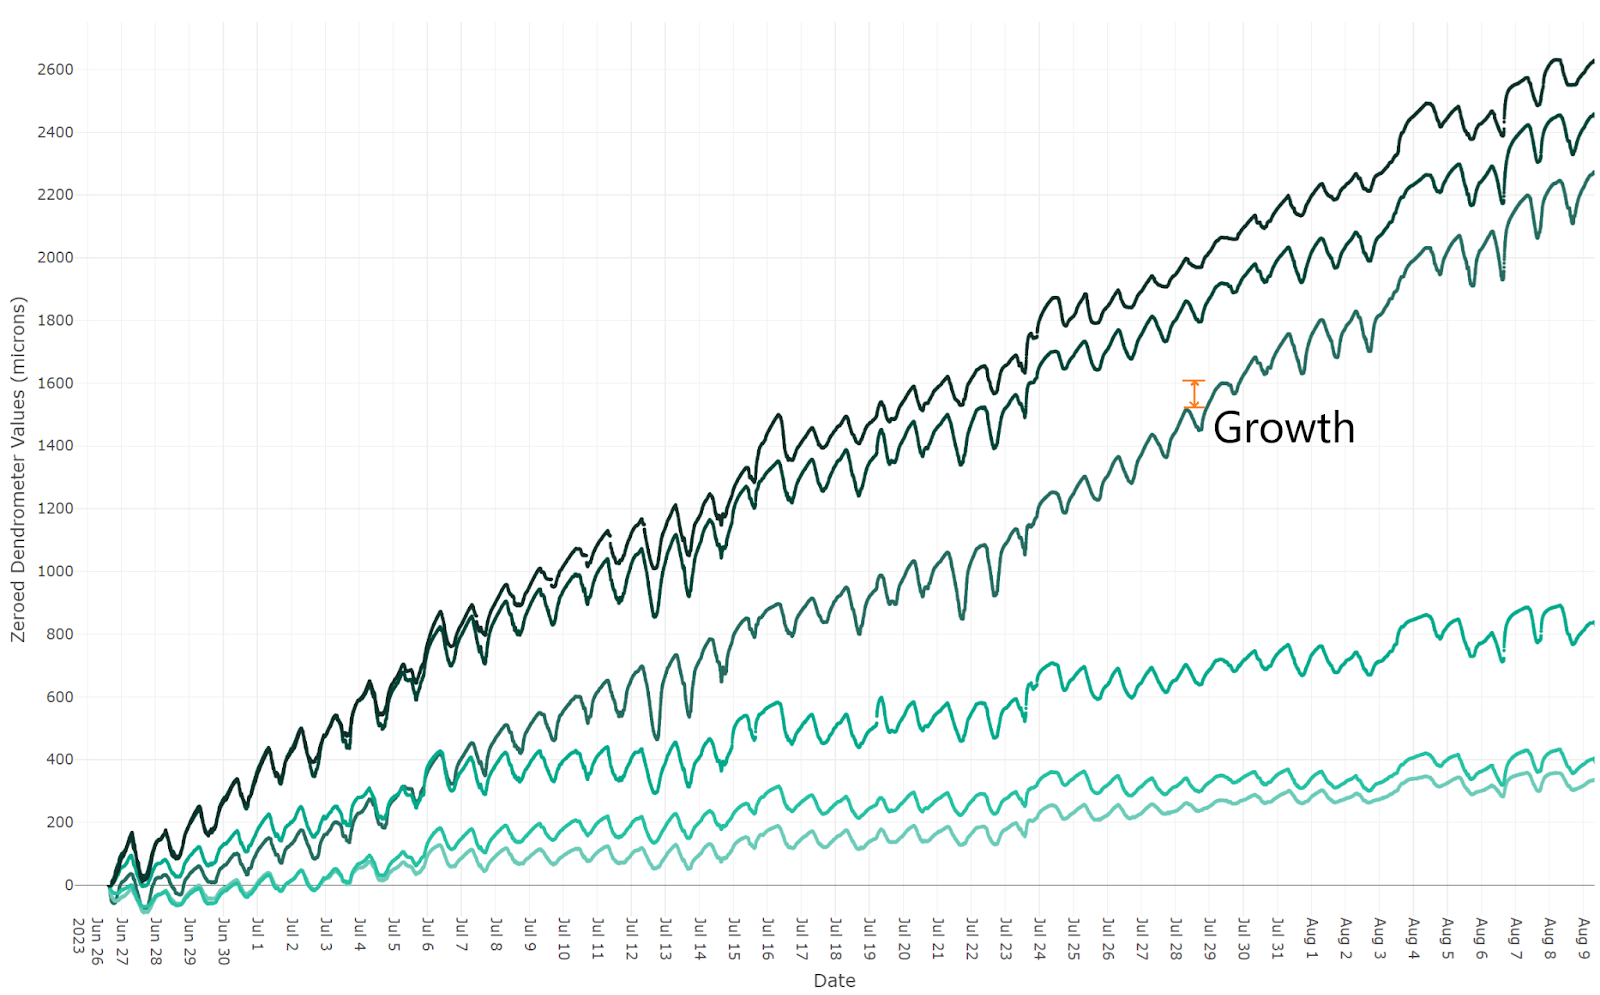
Growth
This is the daily change in the maximum dendrometer value. The maximum values typically occur around dawn, when the tree is under the least tension from transpiration. During the course of the day, and sometimes particularly at night, the tree will create new xylem or wood cells. This is considered an irreversible process, in that once created, the new wood is permanent. If a small amount of growth occurs each 24-hour period, it is manifested in a small increase in the dendrometer reading, each night before dawn, relative to the reading the previous night. Simply, the growth metric is a way to view the tree by ignoring the daily contractions. More growth generally means greater vigor. Growth can vary from tree to tree and even within different mount points on the same tree, and is most useful as a relative metric as it evolves over time within different groups of trees. For instance, growth might be less for a group of trees that are receiving less water than an otherwise identical group of trees.
Negative growth does not imply that wood has somehow been lost. The tree might not thicken to its previous day’s extent for a number of reasons, such as water stress or small changes in the dissolved solids in the sap. Extended periods of negative growth could be cause for concern. During expected dormant periods, such as winter for deciduous trees, growth might remain flat or even trend slightly negative, and this is expected and not cause for concern.
Maximum Daily Shrinkage (MDS)
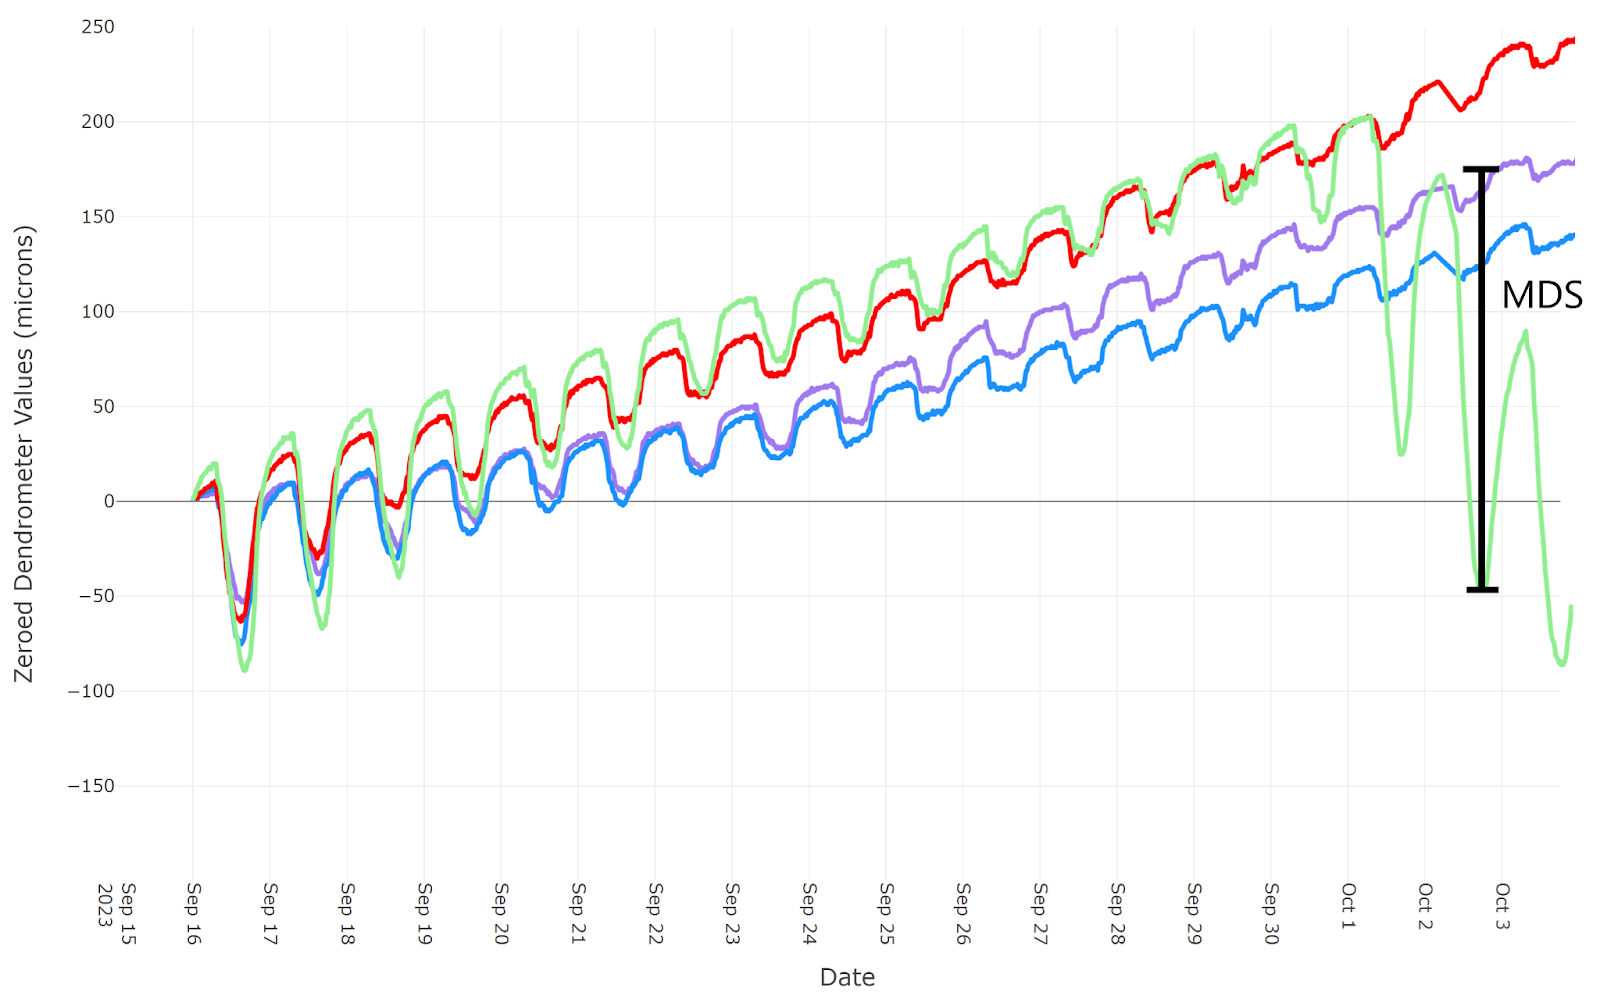
MDS
MDS is short for ‘Maximum Daily Shrinkage.’ It is a complement to the Growth metric in that it is a way to view the tree by only considering the contractions, and ignoring the longer term Growth. It is the difference between the current day's maximum and the current day’s minimum. A larger MDS corresponds to greater relative tension in the tree wood sap. For most trees, the MDS changes day to day as a result of differing environmental loads on the transpiration, such as temperature, humidity, and soil water availability. When soil water is steady, or changing very slowly (such as it would be for large, established trees), the variability in MDS is mostly due to changes in temperature and humidity. How much light the tree receives is also a factor. If the canopy exposure changes, such as during cloudy or partly cloudy conditions, the MDS will reflect this. Baseline MDS, for any given temperature, humidity, soil moisture, or solar exposure, will, like Growth, vary from tree to tree. Thus, like Growth, MDS is best interpreted relative to a group of trees, or relative to the same tree previously in time. For instance, if MDS is changing relative to temperature or humidity differently than it had been, this might indicate that the tree is now experiencing different soil moisture levels. Higher temperatures, lower humidities, and greater solar exposure tend to increase MDS. Lowering soil moisture levels also tend to increase MDS.
Tree Water Deficit (TWD)

TWD
TWD is short for ‘Tree Water Deficit.’ It is calculated similarly to MDS, and the contributors to changing TWD are similar to the contributors to changing MDS. The difference is that TWD is the difference between the current day’s minimum and the historical maximum. TWD and MDS would be identical if last night’s maximum was the historical maximum. Such, the TWD and MDS will generally be the same when the tree is growing a small amount each night. The utility in using the TWD metric is that it considers the accumulated effects of many days of stress. If the tree is not recovering each night (negative growth), the MDS might be steady or even decrease with greater stress, but the TWD will increase. This makes the TWD metric more useful than MDS over many extended days of stress. Many days of negative Growth, coupled with increasing TWD, could be cause for concern. This type of pattern is common when a tree suddenly stops receiving irrigation, say from a faulty valve or clogged/broken emitter.
Copyright © 2024, ePlant, Inc. All rights reserved. V1